Covid inquiry: The UK pandemic in numbers
Explore the data on how the coronavirus pandemic unfolded in the UK.
Hearings have begun in the public inquiry scrutinising the UK’s response to, and impacts of, the coronavirus pandemic.
As the virus spread, government agencies increasingly published figures on case numbers, hospitalisations and deaths.
To follow alongside the inquiry, the BBC’s data team has broken down some of these statistics into key areas from the beginning of the pandemic up to 5 May 2023, when the World Health Organisation declared an end to the virus as a “global health emergency”.

How many people died?
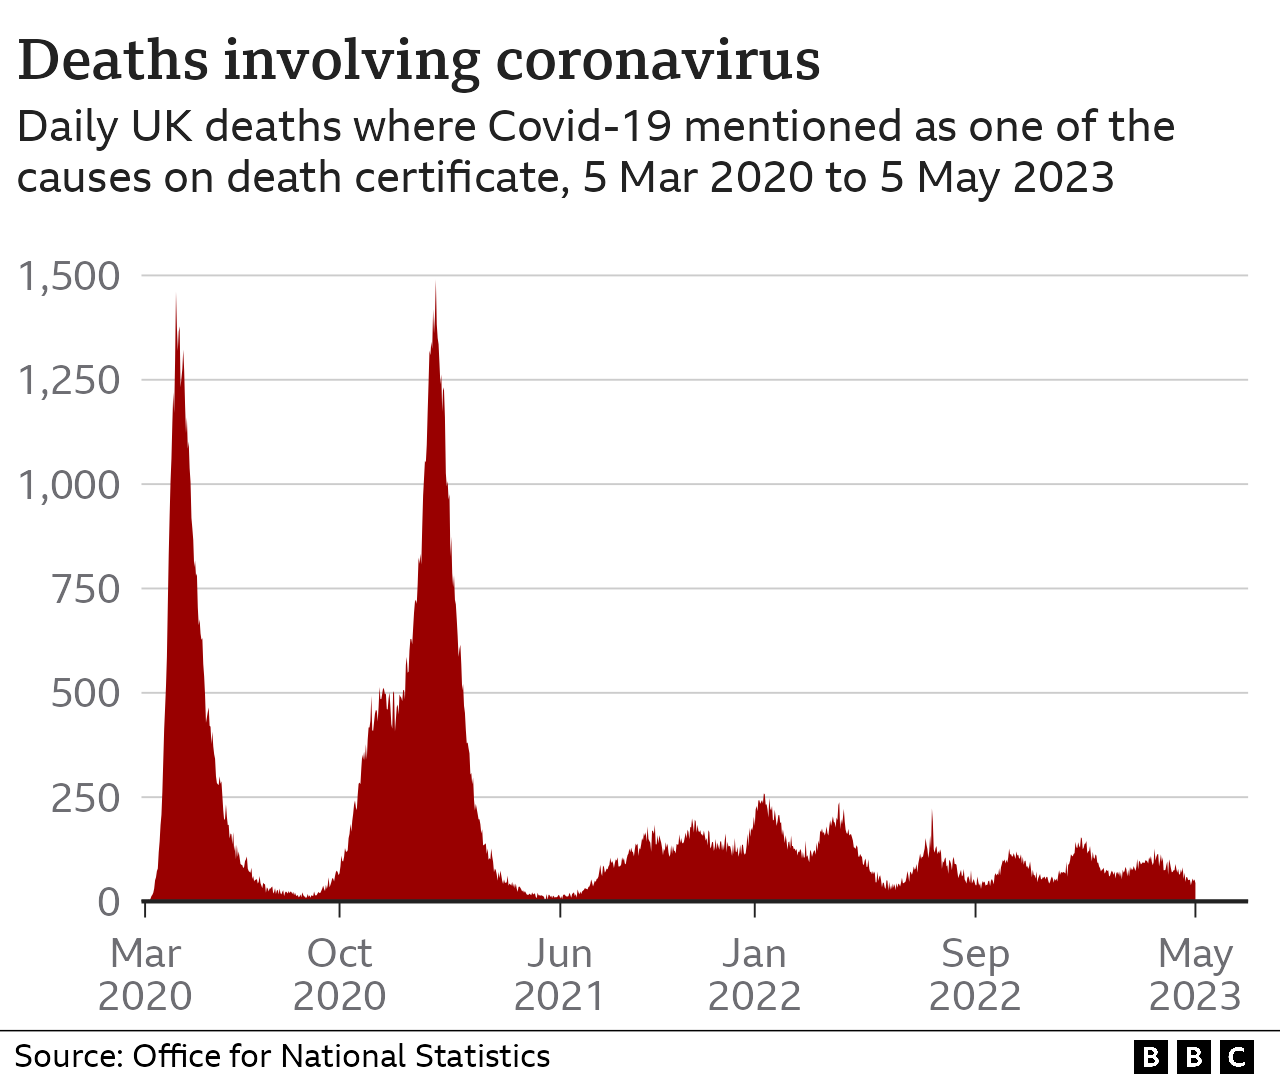
Just under 227,000 people died in the UK with Covid-19 listed as one of the causes on their death certificate. This includes those who had not been tested for the virus prior to their death.
The most deaths reported in this way on a single day was on 19 January 2021, when 1,490 people were registered.
At this point in the pandemic, the first variant of the virus seen in the UK – initially detected in Kent – was dominant. This was subsequently named the ‘Alpha’ variant by the WHO.
The UK was also only a month into the first stages of its vaccine rollout, which started to reduce the risk of death and serious illness from the virus.
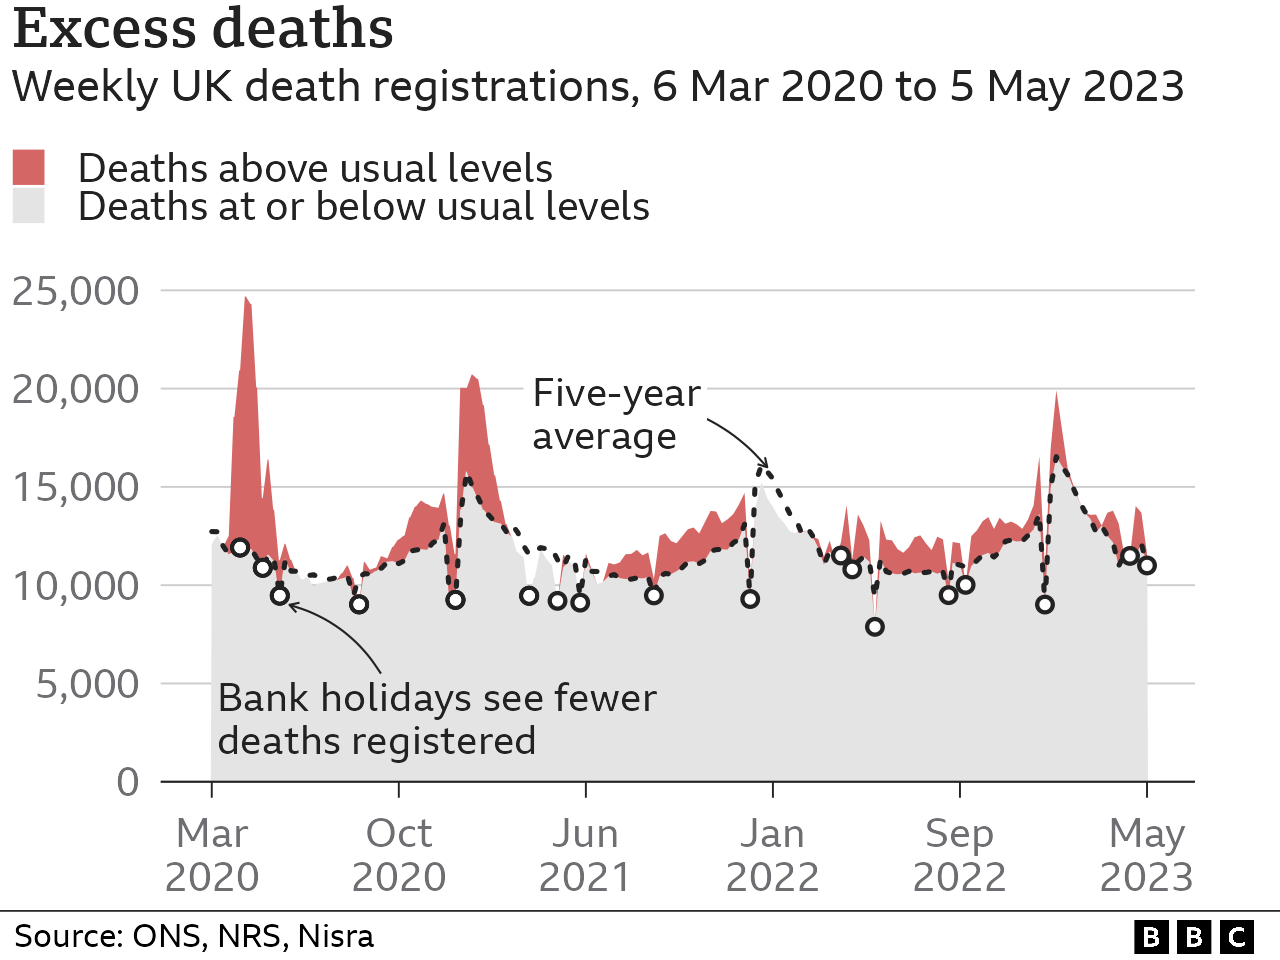
Another way of looking at the impact coronavirus had on the number of people dying in the UK is by counting all deaths over and above the expected number since the pandemic began, sometimes referred to “excess deaths”.
As of 5 May 2023, this was over 208,000 deaths. For most of the previous three years there were above average levels of deaths in the UK.


The highest peaks in the first two years of the pandemic were during periods when many people died directly from Covid. Out of nearly 13,000 excess deaths in mid-April 2020, about 9,500 were attributed to the virus.
But a larger portion of the excess seen in the second half of 2022 were driven by other factors, including flu and pressure on the NHS. Of the 3,300 excess deaths in mid-January 2023, about 600 were from Covid.
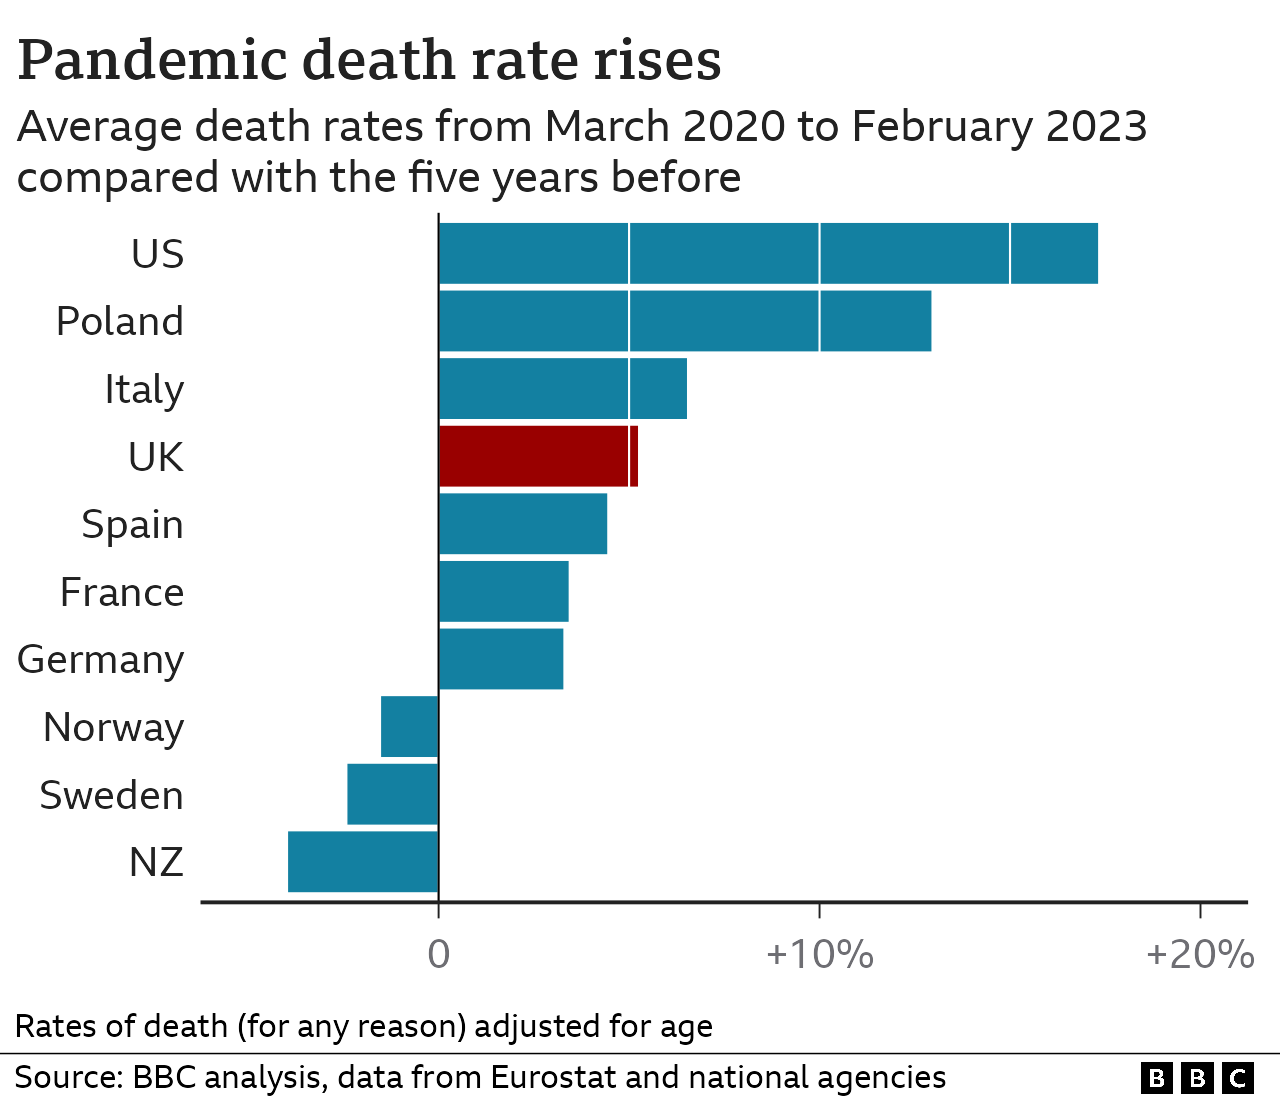
Compared with other countries, over the three years to February 2023, the UK’s death rates went up by more than 5%, which was more than France, Germany and Spain (all up between 3% and 4.5%), but by less than Italy’s (up more than 6%).
The US and Eastern European countries like Poland were even harder hit, with death rates more than 10% above their pre-pandemic levels over the three years to February 2023.

How many people caught the virus?
More than 44 million people in the UK were estimated to have had the virus between April 2020 and February 2022, according to the Office for National Statistics (ONS). This is the most accurate measure available as the total number of infections across the country will never be known.
The ONS ran a regular survey through the pandemic: testing randomly chosen people in order to estimate the number of people who had the virus.
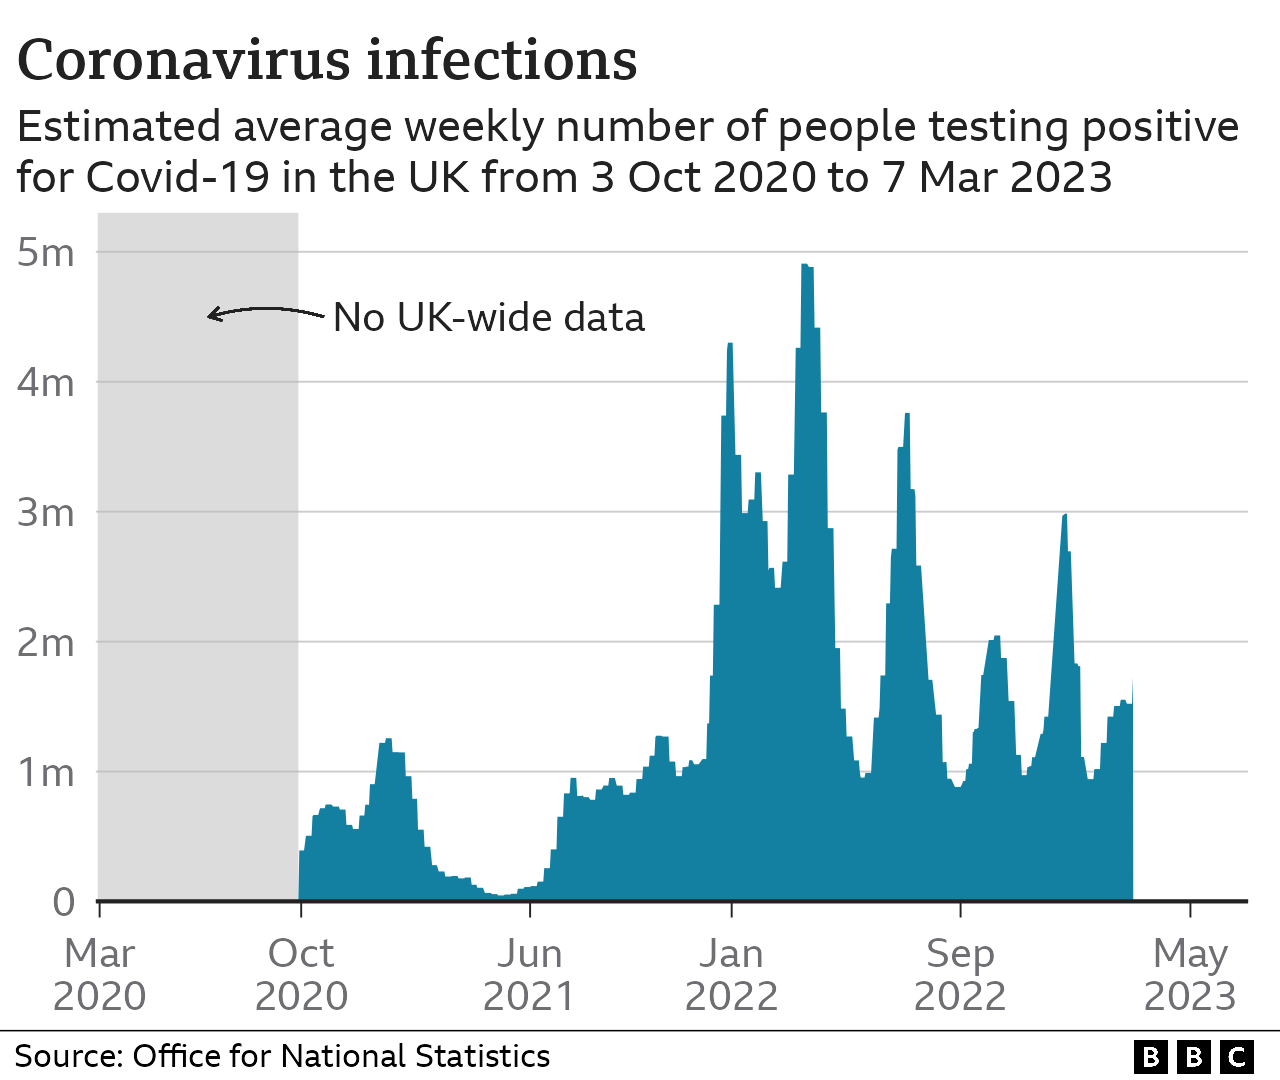
Based on the survey, the estimated peak of the pandemic, in cases if not in deaths, was in late March 2022, where at one point about 4.9 million people were thought to have the virus. However, the survey did not capture the first wave of the pandemic, with trials only beginning in England in April 2020.
Figures are still regularly published on the number of recorded coronavirus cases across the UK, from PCR and lateral flow tests. However, recorded cases are not considered to present the most accurate picture for a variety of reasons, including the availability and reach of testing.

How many people were in hospital?
Patients were admitted to hospital with coronavirus more than 1.1 million times between March 2020 and 5 May 2023 across England, Scotland and Northern Ireland.
These were people who tested positive up to two weeks before arriving at hospital, or while being treated.
In Wales the figures were counted differently, with about 43,000 admissions of those who either had, or were suspected to have, the virus.
The number of patients in hospital with coronavirus peaked in the week to 20 January 2021, at more than 38,000 people.
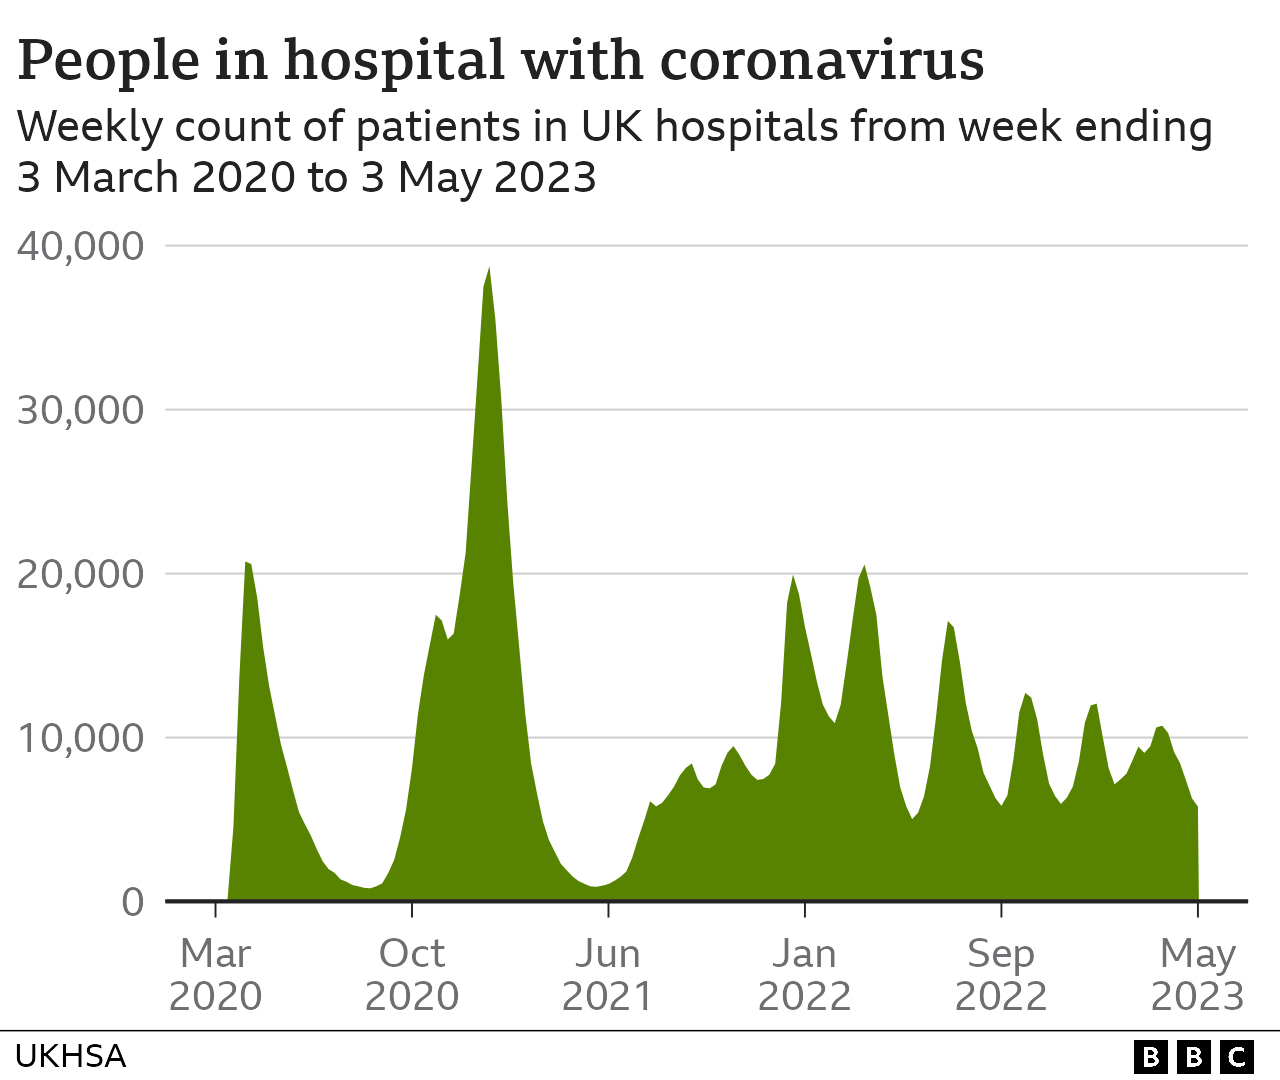
When a new national lockdown was announced on 5 January 2021, across hospitals in England about one in four general admission beds were occupied by patients with coronavirus.
This period was the first time the health service had to cope with both normal winter pressures, and the additional strain from Covid, which was spreading among an unvaccinated population with little immunity.
How many people got vaccinated?
The rollout of coronavirus vaccines began in the UK on 9 December 2020, when the world’s first Pfizer dose was administered to 90-year-old Margaret Keenan in Coventry.
Since then, nearly 176 million Covid vaccines have been administered in various stages up to May 2023. Starting with older and clinically vulnerable people and moving down the age groups into young adults and some children.
Eligible groups were offered two main doses as a minimum, plus a booster dose, with additional boosters for more vulnerable groups later on in the pandemic.
About 88% of people in the UK over the age of 12 (58 million) are thought to have had both a first and second dose of a vaccine, with 93% receiving a single jab.
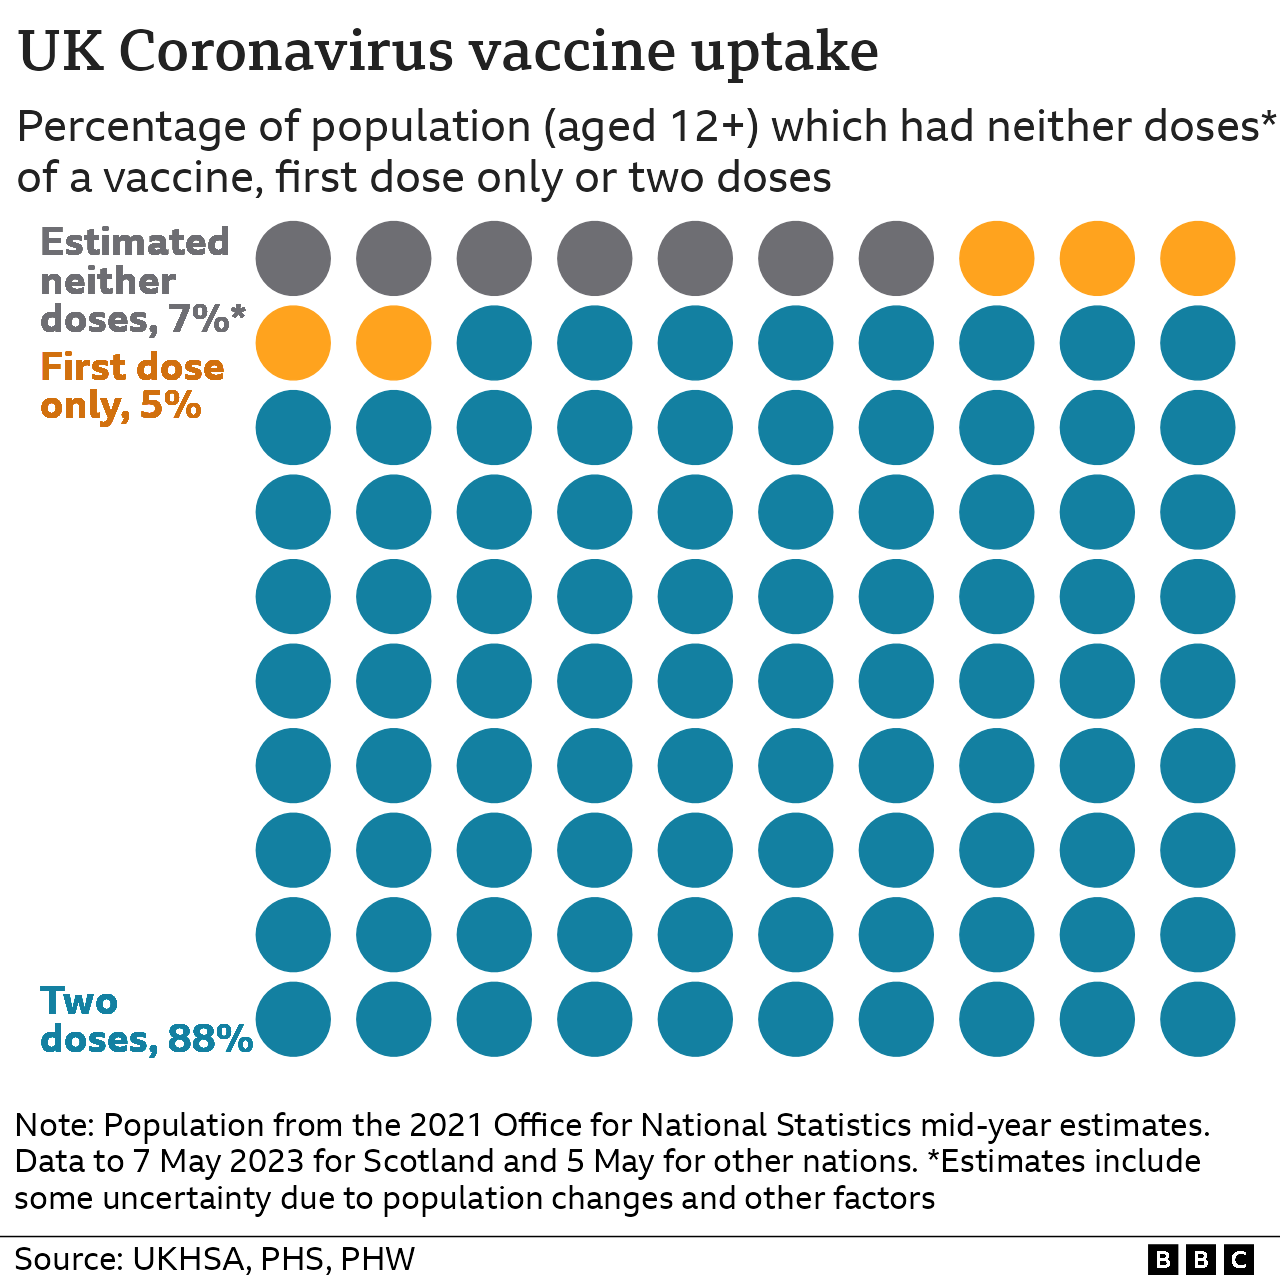
This is based on the ONS mid-year population estimates for 2021, and vaccine data from up to 7 May in Scotland and 5 May for the other UK nations.
There is some uncertainty, especially in the proportion of people who did not receive a jab. The choice of population estimate makes a significant difference to the proportion of people thought to be vaccinated.
A small number of people (fewer than one million as of September 2022) aged 5-11 had received a first and second dose of a coronavirus jab. In addition, vaccinated people are removed from the figures after they have died, which could inflate the number considered unvaccinated.
Related topics
-
-
13 June 2023
-


