History shows stocks go up after Wall Street’s fear index hits these levels, argues RBC
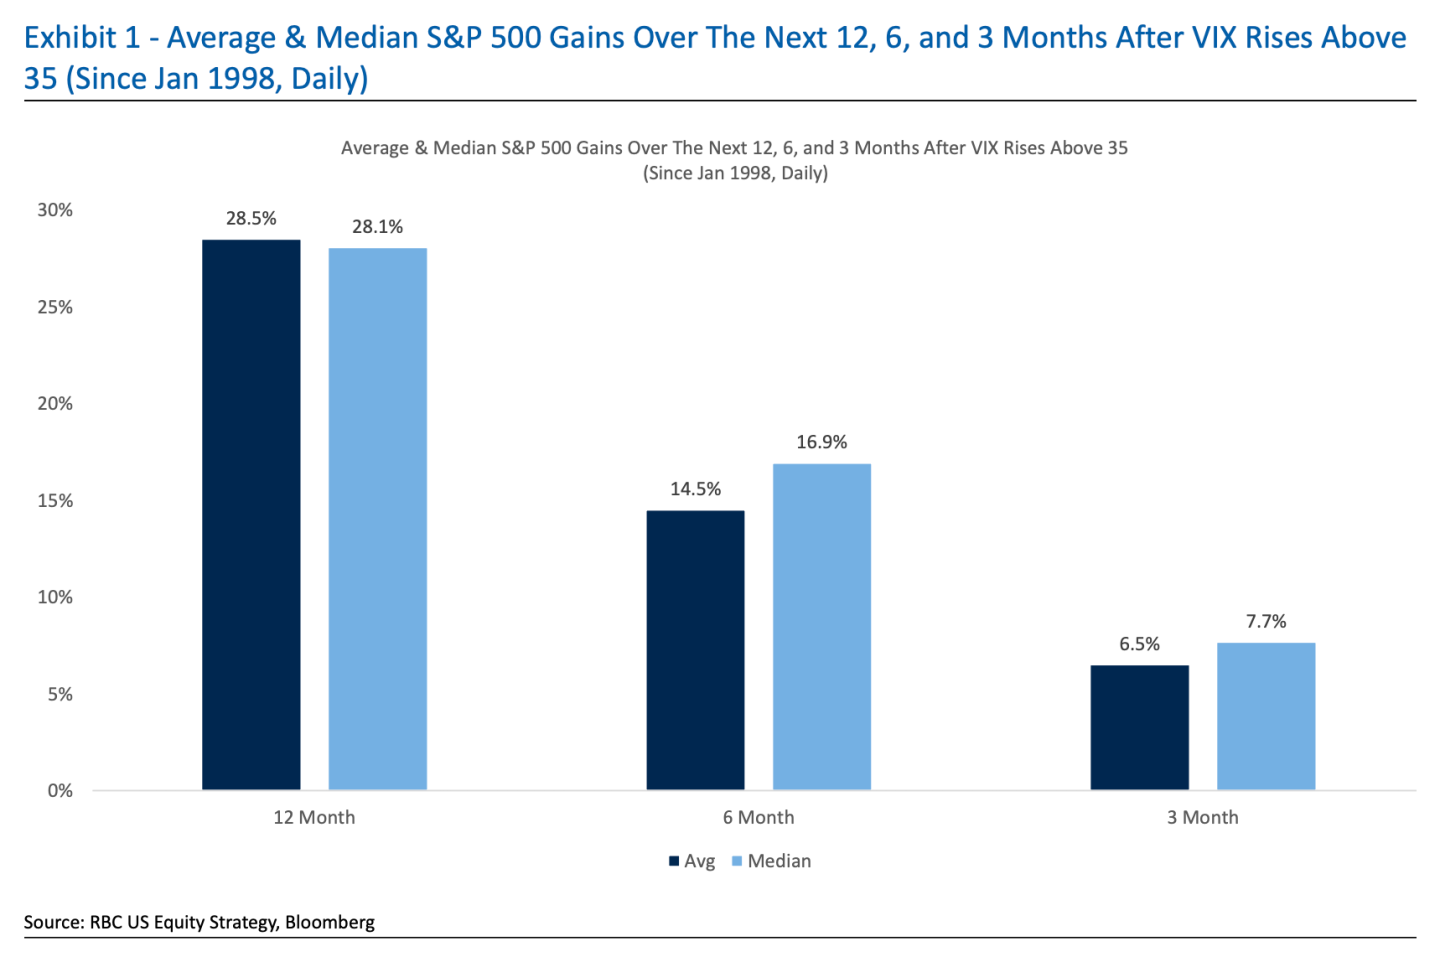
Data suggests once the VIX breaks above 35 points, the S&P 500 index has historically rallied by nearly 29% on average over the following twelve months.

An old rule of thumb among investors is to be fearful when others are greedy and greedy when others are fearful.
While timing the market is tricky to say the least, a historic sell-off in Asia sparked by a sharp appreciation in the yen and subsequent forced unwinding of the carry trade provides an alluring opportunity, according to the Royal Bank of Canada.
RBC’s global equity strategy team believes now could be the time for investors to go bargain hunting after the market’s preferred barometer of fear, the CBOE Volatility Index or VIX, peaked early in the session at 65.7, a new post-pandemic high.
“It’s already surpassed levels we’ve seen in other periods of intense stress in recent decades,” the bank wrote in a research note to clients published on Monday. “It’s tough to say where it will peak at, but our back-testing suggests that the S&P 500 is a buy on a 12-month forward basis when the VIX is above 35.”
Once above this threshold, RBC noted that the S&P 500 index has historically gained during the subsequent three, six and twelve months a respective 6.5%, 14.5% and 28.5% on average, citing data going back to the start of 1998:

The VIX measures the level of expected volatility over the next 30 days that is implied in bid-ask quotes for S&P 500 index options. It is currently sitting at around 33 points after easing over the course of yesterday afternoon.
Earnings season not indicative of a U.S. economy tipping into recession
Some veteran market participants like Ed Yardeni argued the panic was reminiscent of “Black Monday”, when markets abruptly crashed in October 1987.
The bank believes there were numerous catalysts behind Monday’s turmoil, including stretched valuations, lower odds of a Donald Trump victory come November, and the increased likelihood of several cuts in the fed funds rate (the interest banks charge each other to borrow overnight without collateral, effectively set by the Federal Reserve).
“Historically, the stock market tends to sell off after the first Fed cut as investors (we suspect) ponder whether the Fed waited too late to act,” RBC wrote.
Investors have been closely following unemployment data to see whether the so-called Sahm Rule has been triggered. This recession indicator measures directional trends in the U.S. jobs market, though its creator has been quick to point out post-pandemic effects may be distorting the picture somewhat.
RBC seems to agree with that upbeat assessment.
“The overall tone from companies in the current reporting season, as well as commentary on the macro backdrop and labor dynamics, simply don’t sync up with the idea that the U.S. is tipping into recession,” the bank wrote.
Fortune reached out to RBC for comment, but has yet to receive a response.


